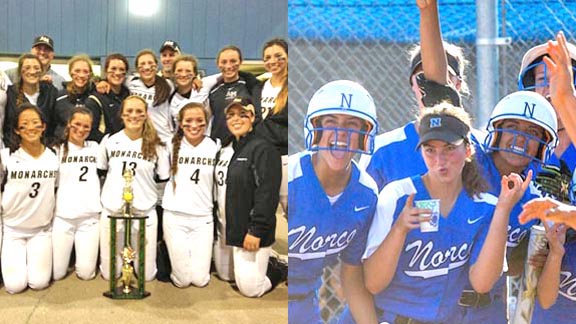
The teams at Archbishop Mitty of San Jose (left) and Norco are shown in several team categories in the first-ever softball state records posted online. The Monarchs also had best record for 2010s while Cougars had the most wins. Photos: Harold Abend & @NorcoHSSoftball / Twitter.com.
We now have a fifth sport with updated state records added to the CalHiSports.com website. It’s softball and we begin with a look at all of the state records in team categories, including pitching, hitting, win streaks, section titles, league titles and all-time wins. Plus, there are game records (two teams). We’ll be adding all of the individual categories for softball next and will have archived state records for all five of the sports primarily covered on this site. California high school softball state records have never been online before and we’ll have them all updated and ready to go in plenty of time before the 2021 season.
Note: We’re going to make this a free post on CalHiSports.com, but the much longer state record lists we’re going to link to will require a Gold Club membership. We now have extensive state record categories in our online archives in football, boys basketball, girls basketball, baseball and softball plus all-state team listings for more than 40 years in all sports. We also will have additional features on players and teams coming soon for Gold Club members as well. To become a Gold Club member for as low as 6.8 cents per day to support this continuing work, CLICK HERE.
Note: We of course utilize MaxPreps.com leader lists for current players and teams and we encourage all schools and coaches to use that platform. There can be errors in those lists, however, that are not edited (especially duplications) and there are still a few players & teams who have unreported totals. MaxPreps also only goes back to the early 2000s. All California records before that were obtained through research by Cal-Hi Sports. We are the only source for state softball records in California.

Longtime head coach Pete Ackermann of Westlake Village Oaks Christian had team in 2004 that had state record 41 triples and once had 46-game win streak. Photo: OaksChristian.org.
Most Consecutive Wins
78 – Ferndale, 2003-2006
73 – Woodland Hills El Camino Real, 1984-1987
50 – Santa Maria Righetti, 1979-1981
48 – San Diego Madison, 1981-83
46 – Cloverdale, 1991-93
46 – Westlake Village Oaks Christian, 2003-04
44 – Sutter, 2008-2010
Most Consecutive League Wins
122 – Boron, 1993-2004
121 – Oakland Skyline, 1994-2002 *
88 – Salinas Notre Dame, 1993-98
82 – Templeton, 1996-2007
75 – Carpinteria Cate, 1997-2000
74 – Mission Hills Alemany, 1976-1983
69 – Bakersfield Ridgeview, 2010-2016
68 – Loomis Del Oro, 1995-2001
66 – Downey Calvary Chapel, 2010-2016
Note: For the complete Gold Club list extended to all teams at 53 games or longer for league win streaks or 35 games or longer or overall win streaks CLICK HERE.
Note: Camarillo Cornerstone Christian started the 2000 season with a reported 72-game league win streak. Length of that streak and when it was over has never been reported.
Most Consecutive League Championships
23 – Lancaster Paraclete, 1979-2001
23 – Pasadena Poly, 1984 -2006
15 – Garden Grove Pacifica, 1992-2006
13 – Belmont Notre Dame, 1975-1987
12 – San Diego High Tech, 2006-2017
11 – Woodlake, 1982-1992
11 – Oakland Skyline, 1991-2001
Most League Championships
30 – Belmont Carlmont, 1978-2019
30 – Lancaster Paraclete, 1979-2019
Most Section Championships
17 – San Pedro, 1976-2017
16 – San Jose Archbishop Mitty, 1995-2019
16 – Woodland Hills El Camino Real, thru 2019
Most Consecutive Section Championships
9 – Salinas Notre Dame, 1998-2006
8 – Hollister San Benito, 2006-2013
Note: For the complete Gold Club lists for most league championships and most consecutive section championships CLICK HERE.
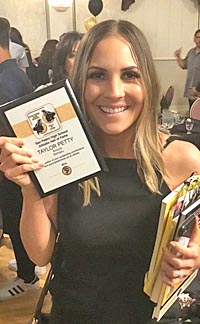
Pitcher Taylor Petty helped San Pedro add to its total of CIF section titles in the early 2010s. Photo: Jamaal Street / San Pedro News Pilot.
Most Wins (Season)
44 – Sacramento Johnson, 1990 (44-8)
42 – Stockton Lincoln, 1985 (42-2)
42 – Fairfield, 1994 (42-4)
41 – Sacramento St. Francis, 1989 (41-3)
Most Consecutive Wins (Season)
35 – Clovis, 2002 (37-3-1)
34 – Fairfield, 1999 (36-2, won first 34)
34 – Sutter, 2009 (34-0)
33 – Norco, 2017 (33-1, lost last)
32 – Huntington Beach Ocean View, 1985 (32-0)
32 – Loomis Del Oro, 1997 (33-2, won first 32)
32 – San Jose Archbishop Mitty, 2009 (32-0)
Note: For the complete Gold Club list extended to all teams with 37 wins in a season or more plus all teams with at least a 28-game win streak during a season CLICK HERE.
Most Shutouts (Season)
31 – Fairfield, 1994 (42-4)
31 – Fresno Bullard, 2001 (36-1)
30 – Fresno Bullard, 1999 (38-1-1)
30 – Fresno Bullard, 2000 (34-2)
29 – Belmont Carlmont, 1999 (35-4)
29 – Fairfield, 2000 (35-3)
29 – Clovis, 2002 (37-3-1)
29 – Sutter, 2009 (34-0)
Most Games (Season)
52 – Sacramento Johnson, 1990 (44-8)
49 – Rancho Cordova, 1984 (34-14-1)
46 – Fairfield, 1994 (42-4)
Note: For the complete Gold Club list extended to all teams with 25 shutouts in a season and with 44 games played during a season CLICK HERE.
Best One-Season Records
34-0 – Sutter, 2009
32-0 – San Jose Archbishop Mitty, 2009
32-0 – Huntington Beach Ocean View, 1985
30-0 – Stockton Lincoln, 1987
29-0 – Santa Maria Righetti, 1980
29-0 – Pleasanton Foothill, 2019
Note: For the complete Gold Club list extended to all teams at 24-0 or better for one season and for best two-season and three-season records CLICK HERE.
Most Consecutive Losses
Sacramento Grant won first game of 1987 after
“nearly 120 consecutive losses,” 1976-1986.
67 – Garden Grove Bolsa Grande, 1997-2001
Most Consecutive League Losses
133 – Reedley, 1987-1995
Not reported: Sacramento Grant 1987-2003.
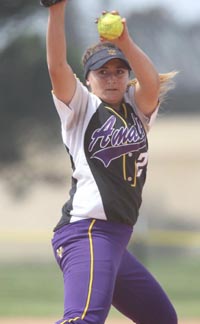
Danielle Williams pitches for Amador Valley (Pleasanton) in 2018. Dons won 83.7 percent of their games in 2010s. Photo: Patrick Takkinen / SoCalSidelines.com.
Best Records in 2010s
239-38 – San Jose Archbishop Mitty (86.3%)
222-41-1 – Union City James Logan (84.3%)
219-42-1 – Pleasanton Amador Valley (83.7%)
279-57 – Norco (83.0%)
Note: In the shortened 2020 season, Mitty went 3-1, Logan 2-0, Amador Valley 1-1 and Norco 11-1.
Note: For additional Gold Club lists for best records in 2000s, best records in 1990s and best record in 1980s CLICK HERE.
Most Wins in 2010s
279 – Norco (279-57)
267 – Westlake Village Oaks Christian (267-56-3)
252 – Clovis (252-85)
Note: In the shortened 2020 season, Norco went 11-1, Oaks Christian 8-1 and Clovis 7-1.
Note: For additional Gold Club lists for most wins in 2000s, most wins in 1990s and most wins in 1980s CLICK HERE.
GAME RECORDS — BOTH TEAMS
Longest Games (Innings)
35 – Huntington Beach Ocean View (1) vs. Huntington Beach Marina (0), 1983*
35 – Loomis Del Oro (2) vs. Auburn Placer (0), 2001*
34 – Salinas North Salinas (8) vs. Gilroy (4), 1997*
30 – Big Bear Lake Big Bear (3) vs. San Jacinto (2), 2001*
30 – Woodland (1) vs. Fairfield (0), 2001*
*Two-day game.
Most Runs
95 – New Cuyama Cuyama Valley (48) vs. Cambria Coast Union (47), 2011
71 – La Jolla Country Day (71) vs. Chula Vista Southland Christian (0), 1979
69 – Alameda (35) vs. Alameda Encinal (34), 1986
Note: Cuyama Valley scored 13 runs in bottom of seventh trailing 47-35. Morgan May led both teams with 14 RBI.
Most Strikeouts
101 – Lakewood St. Joseph (1) vs. Cerritos Gahr (0), 1986 (St. Joseph batters struck out 53 times, 29 innings)
86 – Woodland (1) vs. Fairfield (0), 2001 (Woodland batters struck out 61 times, 30 innings, two days, four days apart)
Note: For additional Gold Club lists for game records (both teams) CLICK HERE.
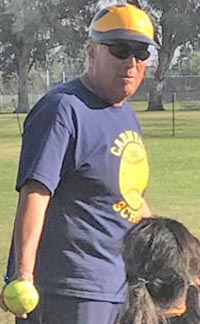
Former Corona Santiago head coach John Perez was at helm at Carnegie of Riverside in 2018 when that team scored state record 477 runs. Photo: SoCalSidelines.com.
Highest Batting Average (Season)
(Minimum 22 games)
.515 – Vallejo St. Patrick-St. Vincent, 2011
(365-709) (27)
.513 – San Bernardino Aquinas, 2018 (314-612) (23)
.489 – Maxwell, 2012 (281-575) (22)
.481 – Pomona Catholic, 2011 (359-747) (29)
.475 – San Bernardino Aquinas, 2013 (376-792) (28)
Most Runs (Season)
477 – Riverside Carnegie Schools, 2018 (25)
430 – Holtville, 1992 (32)
418 – Taft, 2014 (38)
415 – Pomona Catholic, 2012 (33)
412 – Los Angeles King-Drew, 2014 (23)
403 – San Diego Madison, 2011
392 – Wheatland, 2013 (35)
390 – Templeton, 1994 (29)
Note: For additional Gold Club lists for all teams reported with at least a .433 batting average (one season) and for those with at least 340 runs CLICK HERE.
Most Runs (Game)
71 – La Jolla Country Day vs. Chula Vista Southland Christian (0), 1979
62 – Simi Valley Lutheran vs. Calabasas Viewpoint (1), 1987 (3 innings)
60 – Whittier Christian vs. Garden Grove Bethel Baptist, 1978
Most Runs (Inning)
37 – Oakland Head-Royce (50) vs. Emeryville Emery (1), 1990
35 – Simi Valley Lutheran (62) vs. Calabasas Viewpoint (1), 1987 (3-inning game)
28 – Los Molinos (43) vs. Herlong (3), 1988
Note: For additional Gold Club lists for all teams reported with at least 53 runs in one game or 24 runs for one inning CLICK HERE.
Most Hits (Season)
470 – Pomona Catholic, 2012 (33)
460 – Sutter, 2015 (44)
433 – Fairfield, 1994 (46)
431 – Manteca East Union, 2015 (33)
428 – Etiwanda, 2016 (32)
419 – Taft, 2014 (38)
412 – Westlake Village Oaks Christian, 2014 (33)
409 – Red Bluff, 2014 (36)
404 – Chico Pleasant Valley, 2013 (35)
403 – San Diego Madison, 2011 (29)
403 – Riverside Carnegie Schools, 2018 (25)
401 – Pomona Catholic, 2014
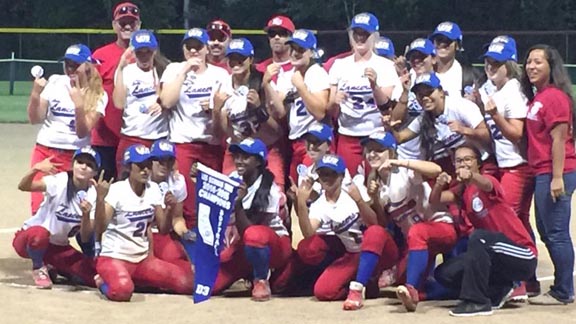
Manteca East Union won CIF Sac-Joaquin Section title in 2015 and had 431 hits, one of highest totals in state history. Photo: Twitter.com.
Most Hits (Game)
50 – Pasadena (43) vs. Pasadena Muir (5), 1986 (4 1/2 innings)
48 – Belmont Notre Dame (57) vs. Atherton Sacred Heart Prep (0), 1984
48 – Yucca Valley (51) vs. Idyllwild Elliott Pope, 1986
Note: For additional Gold Club lists for all teams reported with at least 340 hits in a season or 39 hits in a game CLICK HERE.
Most Doubles (Season)
107 – Pomona Catholic, 2012 (33)
100 – Pomona Catholic, 2014
98 – San Fernando, 2017 (35)
93 – San Andreas Calaveras, 2018 (30)
91 – Santa Ana Godinez, 2019 (30)
90 – Grand Terrace, 2015 (29)
89 – San Bernardino Aquinas, 2015 (27)
88 – Pomona Catholic, 2013
Most Doubles (Game)
18 – Pomona Catholic (36) vs. Riverside Sherman Indian (0), 2012
17 – Pomona Catholic (32) vs. Riverside La Sierra Academy (0), 2014
13 – Pomona Catholic (27) vs. Riverside La Sierra Academy (0), 2013
Note: For additional Gold Club lists for all teams reported with at least 60 doubles (one season) and for those with at least nine doubles in a game CLICK HERE.
Most Triples (Season)
41 – Westlake Village Oaks Christian, 2004 (35)
36 – Susanville Lassen, 2015 (40)
32 – San Andreas Calaveras, 2018 (30)
31 – Templeton, 1994 (29)
30 – Pomona Catholic, 2012 (33)
Most Triples (Game)
12 – Yuba City Faith Christian (30) vs. Sacramento New Life Christian (8), 1998
6 – Torrance South (20) vs. Compton Centennial (0), 2010
Note: For additional Gold Club lists for all teams reported with at least 22 triples (one season) and for those with at least 5 triples in a game CLICK HERE.
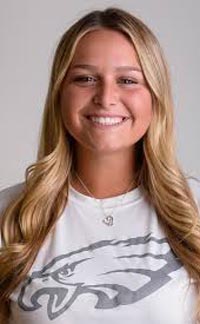
Megan Stevens and teammate Vanessa Taukieaho both hammered home runs at a record clip during 2016 season. Photo: sbsun.com.
Most Home Runs (Season)
65 – Etiwanda, 2016 (32)
63 – Chino Hills, 2019 (33)
58 – San Marcos, 2018 (30)
57 – Cerritos Gahr, 2017 (26)
56 – Chino Hills, 2015 (32)
47 – Beaumont, 2017
46 – Chino Hills, 2014 (36)
44 – Carson, 2011 (30)
44 – Grand Terrace, 2015 (29)
44 – Palmdale Highland, 2015 (31)
44 – Riverside Patriot, 2017 (30)
44 – Ramona, 2017 (33)
Most Home Runs (Game)
10 – Pasadena (43) vs. Pasadena Muir (5), 1986 (4 1/2 innings)
8 – Whittier Christian vs. Buena Park Heritage, 1978
8 – Maricopa vs. Bakersfield Dynasty Christian,1996
8 – Beaumont (16) vs. San Jacinto (3), 2017
Note: For additional Gold Club lists for all teams reported with at least 32 home runs (one season) and for those with at least six homers in a game CLICK HERE.
Most Stolen Bases (Season)
486 – Los Angeles King-Drew Medical, 2006
402 – Los Angeles King-Drew Medical, 2007
396 – Los Angeles King-Drew Medical, 2008
343 – LaVerne Calvary Baptist, 1988
342 – Holtville, 1992 (32)
Most Stolen Bases (Game)
49 – El Centro Central vs. Blythe Palo Verde, 1980
48 – Orland vs. Willows, 1982
48 – McCloud (24) vs. Dorris Butte Valley (8), 1991
Most Times Walked (Game)
49 – Simi Valley Lutheran (62) vs. Calabasas Viewpoint (1), 1987 (3 innings)
Note: For additional Gold Club lists for team stolen base records CLICK HERE.
Mark Tennis is the co-founder and publisher of CalHiSports.com. He can be reached at markjtennis@gmail.com. Don’t forget to follow Mark on the Cal-Hi Sports Twitter handle:


